

| Table of Contents |  |
|
Original Article
|
| Role of quantitative nuclear cytomorphometric and NOR dots count in prediction of carcinogenic induced oral cellular proliferative activity |
| Hussain Gadelkarim Ahmed1, Wijdan Muzamil Ibrahim Diab1, Shadan Atif Abdulgafar1, Awdah M. Al-hazimi2 |
|
1Department of Histopathology and cytology, Faculty of Medical Laboratory Science, University of Khartoum, Sudan.
2College of Medicine, Hail University, KSA. |
|
Article ID: 100001OCYHGA2011
doi:10.5348/ocyj-2011-1-OR-1 |
|
Address correspondence to: Hussain Gadelkarim Ahmed University of Khartoum 102, FMLS Khartoum Sudan Email: hussaingad1972@yahoo.com |
|
[HTML Abstract]
[PDF Full Text]
|
| How to cite this article: |
| Ahmed HG, Diab WMI, Abdulgafar SA, Al-Hazimi AM. Role of quantitative nuclear cytomorphometric and NOR dots count in prediction of carcinogenic induced oral cellular proliferative activity. Oncocytology 2011;1:1–6. |
|
Abstract
|
|
Aims:
To find a better way for predicting the cellular proliferative activity of apparently healthy oral epithelium exposed to certain carcinogens.
Methods: The nuclear area (NA) and nucleolar organizer regions (NORs) counts were compared with that of cytological atypia in 100 cases of epithelia exposed to toombak (carcinogen), 100 controls (non-exposed) and two cases of squamous cell carcinoma (SCC), as internal controls. Results: Significant differences in AgNOR (p<0.001) mean count and NA mean values (P<0.001) were identified between cases and controls. Significant differences were also noted in AgNOR mean count and NA mean values between cases and two cases of SCC. Conclusions: AgNOR mean count and NA are useful markers for prediction of cytologically non-evident proliferative activity of oral mucosa exposed to carcinogens. | |
|
Key Words:
Nuclear area, AgNOR, Oral epithelium
| |
|
Introduction
| ||||||
|
Cancer is one of the major threats to public health in the developed world and increasingly in the developing world. In developed countries cancer is the second most common cause of death. The prevalence of oral cancer is particularly high among men, the eighth most common cancer worldwide. [1] The geographical variations are indicative of differences in the prevalence of risk factors between countries, cigarette and alcohol consumption in particular. Oral cancer (OC) mortality is very high in Sudan, particularly among men due to the habit of Toombak use (tobacco specific nitrosamine (TSN)) rich tobacco. [2] In the Sudan, oral snuff, called toombak in the local language, is home-made from finely ground leaves of Nicotiana rustica, a tobacco species with an especially high content of nicotine and minor alkaloids. This tobacco is mixed with sodium bicarbonate (about 4:1), then water is added to the mixture. After a period of about two hours or longer the mixture, called “saffa”, is placed into the oral vestibule where it remains from a few minutes to several hours. Once the saffa becomes bland, it is replaced by a new quid; this is repeated 10 to 30 times daily, each portion being one to three grams. [3] Detection of a precancerous or cancerous lesion, when small, is one of the most important factors to improve 5-year survival rates of oral cancer. Although surgical biopsy is the most definitive method for diagnosing oral lesions, it is impractical to routinely subject large numbers of patients to biopsy. Recently, cytomorphometric assessments improved by advanced computer-assisted image analysis systems have gained importance. [4] The nucleolar organizer regions or (NORs) are loops of Deoxyribonucleic Acid (DNA) located in chromosomes 13-15 and 21. They are responsible for ribosomic Ribonucleic Acid (RNA) copy [5] [6], and the number of Argyrpphilic NOR (AgNOR) per nucleus has been correlated with rate of transcription of ribosomal RNA, proliferative activity and ploidy. [7] [8] They are more numerous in malignant cells than normal ones. The size and number of NORs are increased in malignant tumors and have a prognostic value. [9] In the present study, we analyzed the cytomorphometric and NORs characteristics of oral epithelial cells in three groups, 1) individuals subjected to toombak (exposed), 2) non-tobacco users, and 3) patients with oral cancer. | ||||||
|
Materials and Methods
| ||||||
|
In this prospective case-control study, a total of 200 clinically healthy volunteers from the city of Khartoum, aged between 14 and 70, with a mean age of 34 years, of which 100 were toombak dippers (cases= exposed) and 100 were non-tobacco users (controls=non-exposed), were initially selected for the study. All toombak dippers (cases) were chosen among persons who have dipped toombak at least for the last five years and at least five times per day. Patients with clinically apparent oral mucosal lesions, and previously diagnosed benign or malignant lesions were excluded from this study. Also, individuals who had drunk any alcoholic beverage for the last five years were not included in the study. Two patients with oral squamous cell carcinoma (OSCC) were included as internal controls. All cytologic smears were collected by the same examiner from the mucosa of the mouth from the toombak dip site. Participants were asked to rinse their mouth with saline solution for a minute before collection of the samples. The specimen collection site was dried by a smooth wipe so as to avoid silver staining of the mucoid material of saliva during application of AgNOR method to the slides. The material was collected by a smooth brush after brushing the dip-site two times, and rinsing and cleaning the brush each time in a saline solution. This was done so as to collect cells from the inner layers of the oral mucosa. The material collected was smeared on two slides and immediately fixed in 95% ethyl alcohol for 15 minutes. One slide was stained according to the Papanicolaou staining method [10] and the other was stained according to AgNOR staining method described by Ploton et al. [11] Papanicolaou staining method: Ethyl alcohol fixed smears were hydrated in descending concentrations of 95% alcohol through 70% alcohol to distilled water, for two minutes in each stage. The smears were then treated with Harris hematoxylin for five minutes to stain the nuclei, rinsed in distilled water and differentiated in 0.5% aqueous hydrochloric acid for a few seconds to remove the excess stain. This was immediately followed by rinsing in distilled water to stop the action of discoloration. Then the smears were blued in alkaline water for a few seconds and dehydrated in ascending alcoholic concentrations from 70% to 95% with two changes of 95% alcohol for two minutes each. The smears were next treated with Eosin Azure 50 for four minutes. For cytoplasmic staining, smears were treated with Papanicolaou Orange G6 for two minutes, rinsed in 95% alcohol and then dehydrated in absolute alcohol. The smears were cleared in Xylene and mounted in DPX (Distrene Polystyrene Xylene) mount. All the reagents used were from Thermo Electron Corporation, UK. Atypia was assessed cytologically by using the criteria described elsewhere. [12] The presence of two or more of the following features were consistent with atypia: nuclear enlargement associated with increased nuclear-cytoplasmic ratio, hyperchromatism, chromatin clumping with moderately prominent nucleoli, irregular nuclear membranes and bi- or multinucleation, scant cytoplasm, and variation in size and/or shape of the cells and nuclei. AgNOR staining Method: The smears were stained according to the AgNOR staining method. Working solution was freshly prepared by mixing one volume of 2% gelatin in 1% formic acid solution and two volumes of 50% aqueous silver nitrate solution. All smears were treated with silver stain to detect AgNORs as follow: Smears were rehydrated by passing through descending graded alcohol to water, excess water were shaken off and slides were placed horizontally in humidified staining container. Smears were covered by silver solution, and were placed in a dark place for 45 minutes. Slides were then washed in three changes of water. Smears were immersed in 5% Sodium thiosulphate for 10 minutes followed by washing in running tap water. In the last step smears were dehydrated, cleared in xylene and mounted in DPX and were ready for examination. AgNOR sites appear as intranuclear black dots in a pale yellow background. Two investigators, blind to the study groups, analyzed the silver-stained cells under light microscope (Olympus BX-1, Japan) at 1000x magnification. All smears were screened horizontally from left to right and AgNORs were counted in the nuclei of the first 50 non-overlapping, inner layers, nucleated epithelial cells. Superficial cells with pyknotic nuclei were not counted. The AgNOR count was made adopting the method described by Crocker et al. [13] AgNORs, which were visible as black-dark brown dots located within the nuclei of the cells, were counted; overlapped black dots were counted as one structure. The number of AgNOR dots was counted in 20 cells and the mean number was obtained for each smear. To calibrate the examiners, ten smears from each group (cases, controls and internal controls) were counted two times in a non-consecutive way. Mean number of AgNORs and mean percentage of nuclei with more than three AgNORs was also calculated. For calculating the nuclear areas of the epithelial cells, twenty cells, having the same properties as the cells whose AgNORs were counted, were selected and the nuclear area of each cell was calculated via the microscopic stage micrometer. All smears were examined under the light microscope using 40x magnifications. The mean NA of 20 cells was measured for each smear and the results multiplied by 2.4 to convert it into microns. Statistical analysis: SPSS version 17 software was used for statistical analysis. The numeric results (AgNOR counts and nuclear areas) were expressed as mean±SD, and the 95% confidence intervals (CIs) of the means were calculated. The ?2 test was used to compare the differences in categorical variables between the groups. Relationships between variables were analyzed using Pearson’s correlation analysis. A p<0.05 was considered statistically significant. Ethical consent: Each participant was asked to sign a written ethical consent form during the interview, before the specimen was taken. The informed ethical consent form was designed and approved by the ethical committee of the Faculty of Medical Laboratory Research Board, University of Khartoum. | ||||||
|
Results
| ||||||
|
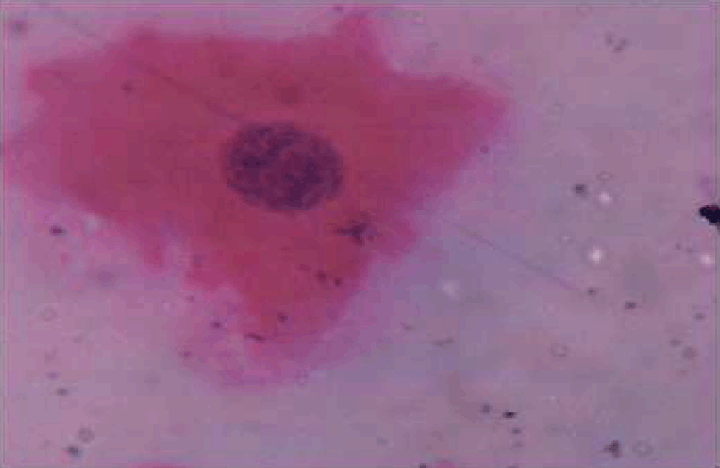
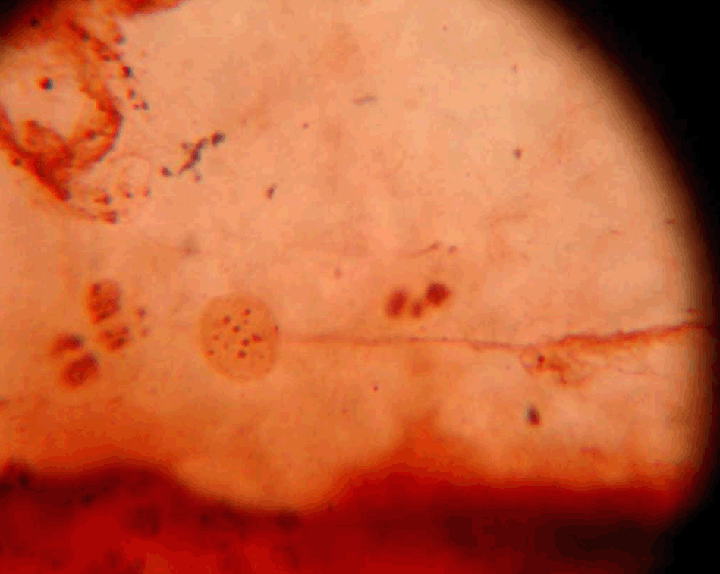
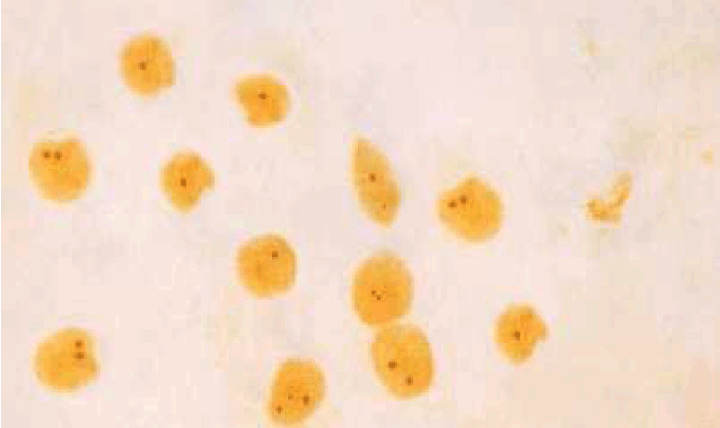
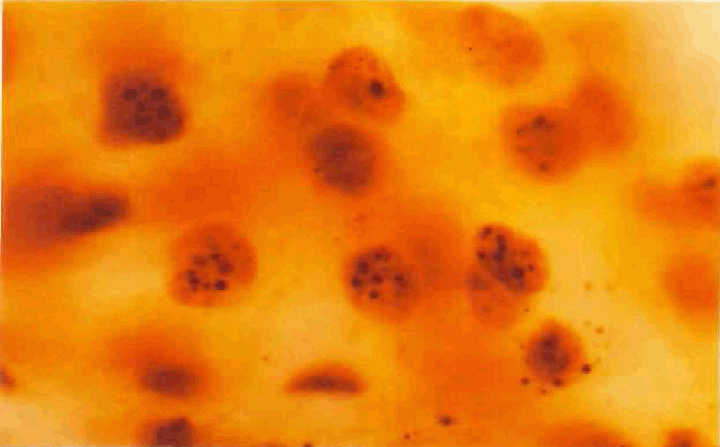
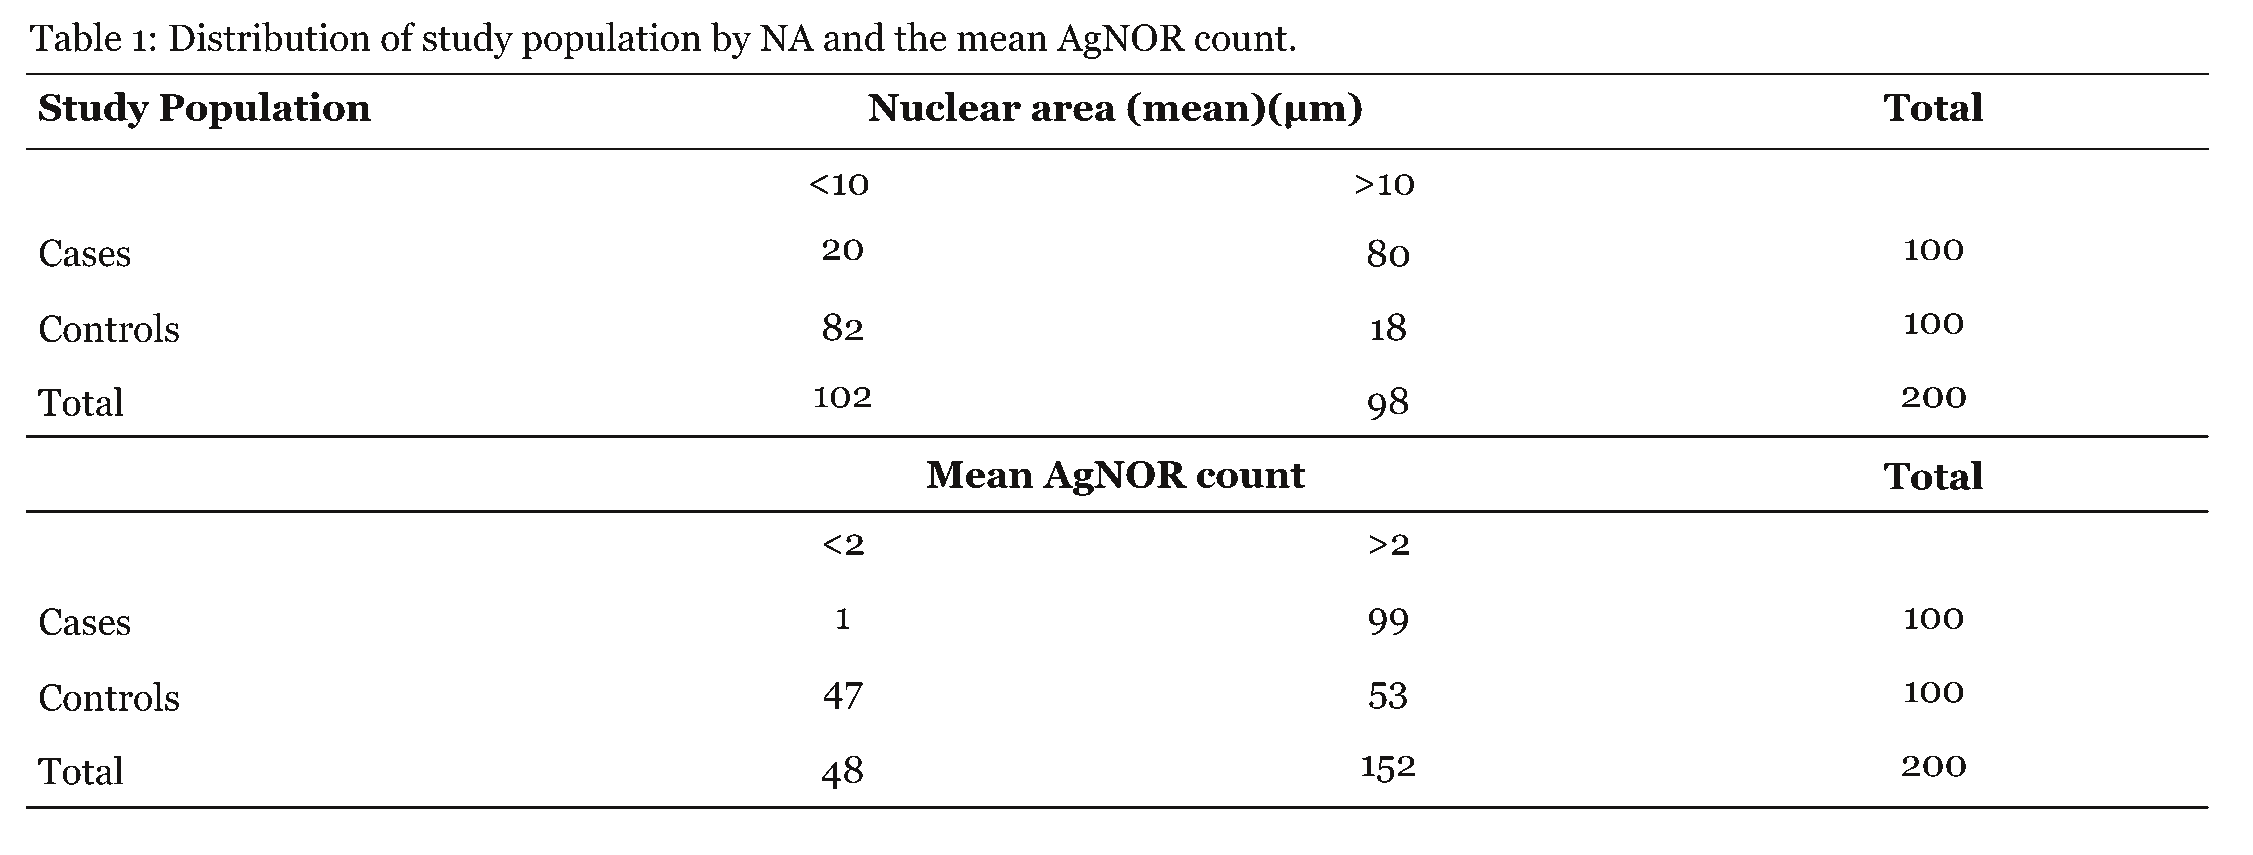
In this case-control study the mean AgNOR and NA counts were assessed among 202 individuals. The age mean was 34±10.8 years in the study population; the age distribution was similar among cases and controls. Cytological atypia was identified in four cases and was not present in controls (P<0.04). On Pap stained smear cytological atypia was identified in all cases with OSCC (internal control) (figure 1). The mean±SD of nuclear area of the oral epithelial cells of cases (10.67±0.087µm2) was significantly higher than controls (9.39±.090µm2) (p<0.001). The mean±SD of AgNOR count per nucleus in the controls (2.15±0.03) was lower than the cases (3.32±0.07) (p<0.001) (figures 2, 3, 4). The mean number of nuclear area measuring more than 10µm2 was 80% in cases (exposed), 100% in cases of OSCC and 18% in controls, while the mean number of nuclei having more than two AgNOR dots was 99%, 100% and 1% in cases (exposed), cases with OSCC and controls, respectively, as shown in Table 1. All four cases with cytologic atypia have shown NA < 10µm2 and AgNOR < 3 dots per nucleus. | ||||||
| ||||||
| ||||||
| ||||||
| ||||||
| ||||||
|
Discussion
| ||||||
|
In this study we have taken toombak dippers as cases exposed to carcinogens, since toombak carcinogenicity is well established. Chemical analyses have shown that toombak contains high concentrations of the highly carcinogenic nitrosonornicotine (NNN) and 4-(methylnitrosamine)-1-(3-pyridy1)-1-butanon (NNK). [14] In fact, levels of these nitrosamines in toombak are 100-fold higher than those in Western snuff products. [15] Epidemiological evidence suggests that toombak is a risk factor for cancer of the oral cavity and possibly of the esophagus in the Sudan. [16] [17] [2] Since, these studies indicate that the habit of toombak dipping plays a role in the etiology of oral cancer, we considered cells obtained from oral mucosa of toombak dippers as epithelium exposed to carcinogens. The employment of oral exfoliative cytology in clinical practice has declined due to the biased nature of its interpretation and because there may be only a small number of atypical cells in a smear. The recent use of quantitative methods has enhanced the potential role of cytology, inspiring a re-evaluation of its value in the early detection and diagnosis of oral cancer. This study considers the influence of the quantitative analysis of cytomorphology (NA) and NORs cell proliferative markers applied to oral exfoliative cytological samples. The findings of the presence study indicate that oral cytology may provide an important addition in the assessment of the patients with precancerous and potentially cancerous oral lesions. The current study shows that the mean of (NA) of the oral epithelial cells of cases was significantly higher than controls (p<0.001). Therefore, this cell proliferation marker (NA) is a useful marker for early prediction of cellular proliferative activity on oral exfoliative cells that are exposed to carcinogens (e.g. toombak). Measurement of nuclear size, cell size and nuclear/cytoplasmic ratio were the three most important factors to consider when producing a baseline for normal oral squamous epithelium. [18] Many studies found that, the use of tobacco influences the cytomorphology of the normal buccal mucosa. [19] [20] The study by Pektas et al. [4] concluded that cytomorphometric analysis via oral brush biopsy is a valuable adjunct to biopsy for identification of premalignant and early stage cancerous oral lesions as a rapid and minimally invasive procedure with high specificity and sensitivity rates, requiring no topical or local anesthetic. However, there is only one study [21] which assessed the NA among toombak dippers and found significant elevation in the mean NA in comparison with non-tobacco users. Nucleolar organizer regions (NORs) are located in the cell nucleoli during interphase. They are loops of DNA in which ribosomal RNA is encoded. Their number per nucleus has been shown to be correlated with the rate of ribosomal RNA transcription, cell proliferation and DNA ploidy. [22] The mean AgNOR dot counts have been of great value for the appraisal of cellular proliferative activity that is commonly verified in pre-malignant and malignant changes. [23] A number of studies have pointed out that the AgNORs count is a rapid and an easily reproducible method which permits a clear distinction between malignant and benign cells. [24] [10] [21] Results of both mean AgNOR counts and mean NA show that cellular proliferation is significantly higher in toombak users and this causes an increase in the nuclear atypical changes of oral epithelial cells, which can be accepted as a progression towards features of dysplastic cellular changes. It is well established that, changing of a normal cell to a malignant cell requires the occurrence of a precursor non- malignant cell, which exhibits increased DNA changes, cell proliferation and apoptosis. [25] However, one of the limitations of this study is that we did not count the cytoplasmic area which might give extra evidence for cellular proliferative activity. Moreover, the use of oral exfoliative cytology as a diagnostic aid accentuates the need for establishing an accurate baseline, thereby enabling the comparison of abnormal oral tissue with established baseline. Some studies have assessed these markers in association with many other variables. The study by Patel et al. [26] assessed changes in the nuclear area (NA), cytoplasmic area (CA), and nuclear:cytoplasmic ratio (N:C ratio) values for clinically normal gingival smears in relation to age and sex of apparently healthy subjects. The result showed that there was a significant difference (p<0.001) in NA, CA, and N:C in males and females of different age groups. The difference in N:C between males and females was significant (p<0.001) in all the groups. The difference in NA, CA, and N:C with age irrespective of gender was significant (p<0.05). There was a significant difference (p<0.05) between males and females with respect to NA, CA, and N:C irrespective of age. Many studies have shown that cytomorphometric analysis of keratinocytes can serve as a useful adjunct in the early diagnosis of oral squamous cell carcinomas. [27] [28] In conclusion, our results support the use of NA and NORs as cellular proliferative markers for prediction of cellular atypical changes that might develop into premalignant or malignant lesions. Techniques for performing NA and AgNORs are cheap with non-invasive sampling procedure, which might be suitable for comprehensive screening of at risk population (exposed to carcinogens). As toombak use is common in the Sudan, All those concerned in the habit of toombak use should undertake a constant screening program. | ||||||
|
References
| ||||||
| ||||||

| [HTML Abstract] [PDF Full Text] |
|
Author Contributions:
Hussain Gadelkarim Ahmed - Substantial contributions to conception and design, acquisition of data, drafting the article, revising it critically for important intellectual content, final approval of the version to be published Wijdan Muzamil Ibrahim Diab - Substantial contributions to conception and design, acquisition of data, interpretation of data, revising it critically for important intellectual content, final approval of the version to be published Shadan Atif Abdulgafar - Substantial contributions to conception and design, acquisition of data, interpretation of data, revising it critically for important intellectual content, final approval of the version to be published Awdah M. Al-hazimi - Substantial contributions to conception and design, acquisition of data, drafting the article, revising it critically for important intellectual content, final approval of the version to be published |
|
Guarantor of submission:
The corresponding author is the guarantor of submission. |
|
Source of support:
Nil |
|
Conflict of interest:
Authors declare no conflict of interest. |
|
Copyright:
© Hussain Gadelkarim Ahmed et al. 2011; This article is distributed the terms of Creative Commons attribution 3.0 License which permits unrestricted use, distribution and reproduction in any means provided the original authors and original publisher are properly credited. (Please see Copyright Policy for more information.) |
|
|